Big Data in a Nutshell
In today’s high-tech, contemporary society, it’s indisputable that an enormous amount of big data is being collected around the clock. As a result, it has paved the way for big data to be transformed into real-life, actionable knowledge. More importantly, through the acquisition of this knowledge, decision making can be positively impacted and consequently improved. However, for this entire process to take place, the correct smart tools need to be employed. It’s imperative to note that the key differentiator between a tool and a smart tool is that the latter always requires a spark that is a smart idea on how to use collected data in a new and innovative way. In a nutshell, this is how big data can be transformed into smart data.
For example, cross-device advertising is a contemporary marketing solution in which Roqad excels in turning big data into smart data. In general, the solution consists of identifying devices that belong to the same user. To better understand it, let’s imagine a huge graph whose nodes correspond to devices. The devices are recognized by different types of identifiers, such as cookies (for desktop and mobile web) and mobile device IDs (i.e. IDFA, Android Advertising ID). The motive is to uncover the edges in the graph, which link devices belonging to the same user. Having a clique of such devices, you’re subsequently able to identify an anonymous user. This graph of anonymous users and their devices are better known as an identity graph.
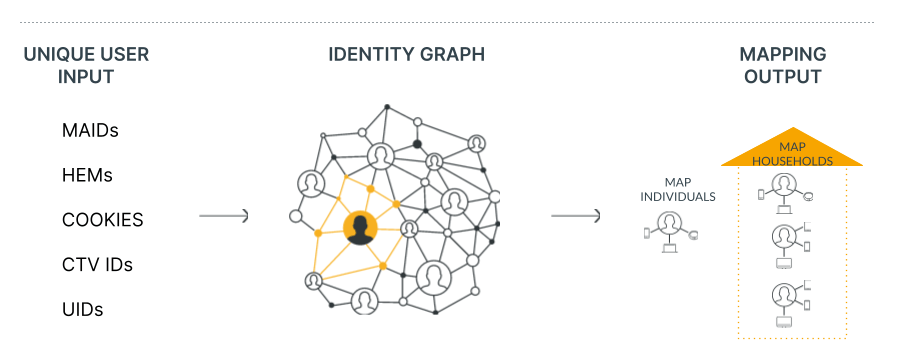
Table 1: Device IDs can be either cookies (for desktop and mobile web), IDFA (Identifier for Advertisers) or AAID (Android Advertising ID). IDFA and AAID identify mobile devices.
In order to find connections, device information collected from web activity needs to be applied. This process can be rather difficult as sometimes you’ll only receive tiny traces of the device activities, which you’d need to follow in order to do your job as a digital detective. Think of it in this way: it’s like peeking through a keyhole to understand what’s happening in a room. These traces are generally HTTP requests received from partners, and generally may contain the following information:

It’s noteworthy to point out that at Roqad we have built a system where any vulnerable personal information is anonymized, so there is no possibility to directly identify devices or users.
Unfortunately, the collected requests can be very noisy, seeing as they can be generated by bots, contain bias to specific services (and therefore users), but also device IDs may not really be actual device IDs. Regarding that last point, it’s essential to be aware that a single device can be seen through many cookies and each cookie is valid for a short time period (about 30 days on average). Consequently, this can create quite a headache when attempting to analyze cross-device data.
Machine Learning
Once the database of HTTP requests is created, similarities in activity between devices is sought. If an observation of some form of similar behavior is noted, a decision as to whether a given pair of devices belong to the same user can be made.
The problem of matching devices can be solved in the following way. Having two devices, A and B, one can manually develop a formula for computing the probability that A and B are connected (i.e., belong to the same user) by using information from the HTTP requests such as visited URLs, used IPs, name and properties of a browser, etc. In general, this formula can be guessed, can be based on intuition or deeper expert knowledge. By working on this formula, you’ll probably end up with something that you hope will get good estimates of the probability that A and B are connected.
However, there is a more effective, alternative method of deriving this formula. Instead of explicitly coding the solution for cross-device matching, it can be done implicitly by employing machine learning. For this approach, examples of connected and disconnected devices need to be collected. This information comes from deterministic data, which are HTTP requests with additional information that indirectly identify users. This could be, for example, a hashed email address. By feeding a learning algorithm with these examples, the code for the formula will be written in an implicit way and therefore a machine will solve the difficult problem, that is cross-device matching, for you.
To put this further into perspective, let’s briefly touch on the Roqad supervised algorithm. The algorithm works in a two-step process. The first step selects candidate connections, i.e., pairs of devices that likely belong to the same user. The second step of the algorithm then assigns each candidate connection a precise probability estimate of being a true connection. In this step, we utilize a probabilistic classifier trained on a part of deterministic data. The rest of the deterministic data is used to test the algorithm. The data are split into the training and test set by user identifiers (i.e., all requests for a given user are either in a training or test set). This splitting ensures that proper estimates of the performance of the supervised algorithm are obtained.
By using the two-step approach, the scalability of the algorithm can be controlled. To better explain why, here’s an example:
Let’s assume that we have 10 million devices. For this number of devices, we have: 45 X 10¹² possible connections.
[ Since (10 * 9)/2 = 45 ]
That’s 450,000,000,000,000 possible connections.
That’s a lot.
There is no algorithmic solution that could deal with such a number of entities. Therefore, by using smart candidate selection, you can end up with only a tiny part of possible connections for which we are able to call the probabilistic classifier.
This is, however, not the final solution. Up until now, probability estimates for candidate connections have been obtained, which generates a graph of devices that are connected by weighted edges. The next step is to translate this graph into a graph of users with their devices. For this purpose, the domain knowledge about the distribution of devices per user is used. As a result, a good structure in which users are able to be recognized (indirectly) as sets of connected devices is received.
Testing of cross-device matching solutions
There is, however, a question as to whether the formula and the resulting graph is indeed high quality. This leads to another general problem of how to test and assess cross-device products. There are two possible ways of testing a cross-device matching solution: unsupervised and supervised. The former can always be used, even without deterministic data, while the latter requires them.
In a typical application of cross-device matching solutions, an identity graph would be queried using a set of device IDs. These device IDs could be relatively well-known to you if, for example, they come from a client. The first metric that describes quality of the cross-device solution is the device overlap, i.e., how many of the devices (included in the query) are in the identity graph. It can be nicely expressed by a fraction of overlapped devices to all devices included in the query.
Once satisfied by the overlap, you can check whether the identity graph is able to deduplicate the device IDs, (i.e., check which of the device IDs belong to the same users). The device deduplication can then be computed as a fraction of deduplicated devices to all device IDs included in the query.
It is also possible to inquire whether other device IDs that are connected with those that are known exist. This is better known as device enrichment, which is a fraction of enriched devices to all device IDs included in the query.
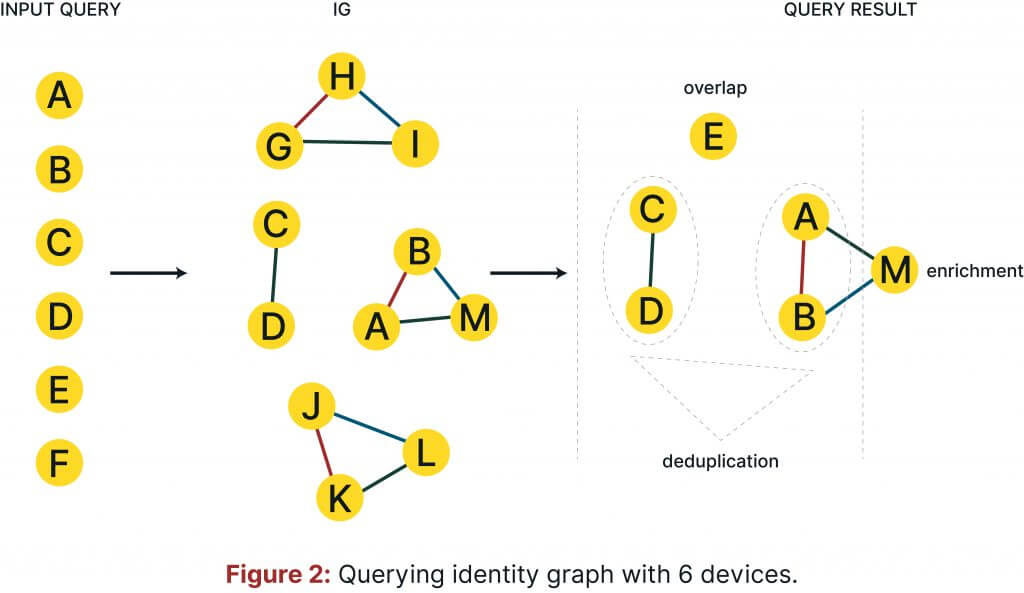
To clarify the definitions given above, let’s consider the following simplified example:
Let us assume that you query an identity graph with 6 device IDs: a, b, c, d, e, f, and that the identity graph contains 5 cliques of devices: (a, b,m), (c,d), (e), (g,h,i), (j,k.l). In this case, the overlap is 5/6, i.e., five device IDs are also contained in the identity graph.
The deduplication rate is 4/6, as the following connections have been found (a,b), (c,d), which contain in total four devices from the query. Enrichment in turn is also 2/6, since only two devices are connected to an unknown device, i.e., a and b are connected to m.
However, the aforementioned metrics do not say anything about predictive performance of the identity graph. Therefore, a separate test set of deterministic data is needed. Following that, precision and recall can be checked.
Precision is a fraction of predicted matches between devices that are the actual/true ones, whereas recall is a fraction of total actual matches that are correctly identified. There is a natural trade off between precision and recall which can be manipulated by setting a cut-off threshold on prediction scores, i.e. removing connections with probability below threshold. This enables you to tune an identity graph for different business strategies. For a low threshold, we obtain high recall, but precision is low. This type of graph can be used for audience amplification. For high thresholds, precision increases, but recall drops. This high precision graph can be used for attribution analysis. A harmonic mean of precision and recall, often referred to as an F-score, is a good measure of the aforementioned trade off. The figure below shows precision, recall, and F-score as a function of the prediction cut off threshold.
Conclusion
There are of course other places in cross-device technology where machine learning can be applied. As this is a part of a new series, stay tuned for more on how Roqad uses the most recent advances in artificial intelligence to build and enhance its cross-device products.
Stay in the Know
Get news, resources and updates about events happening in the world of digital advertising.